
The Automation Opportunity Matrix: How to Identify What's Actually Worth Automating
Most organisations know they should be automating more. The problem is rarely a lack of ambition. It is a lack of clarity about where to start.
Some teams automate the first process someone complains about. Others commission a transformation programme that maps every workflow in the business, takes six months, and produces a report that nobody acts on.
Both approaches miss the point.
The organisations that get the best return from automation are not the ones that automate the most. They are the ones that automate the right things. And they use a simple, repeatable framework to decide what qualifies.
The Matrix
Automation opportunities can be evaluated against two axes:
Total effort eliminated - this is not just how often a process runs, but volume multiplied by the time each occurrence takes. A process that runs 10,000 times a year and takes ten minutes of manual effort each time eliminates far more effort than one that runs 10,000 times but only takes ten seconds for a human. This is the value axis.
Implementation and maintenance difficulty - this is a composite of three dimensions:
- Process stability - how often do the business rules change?
- Environmental control - do you own the systems involved, or are you dependent on external platforms?
- Data predictability - are the inputs clean and consistent, or messy and variable?
Together, these produce four quadrants:
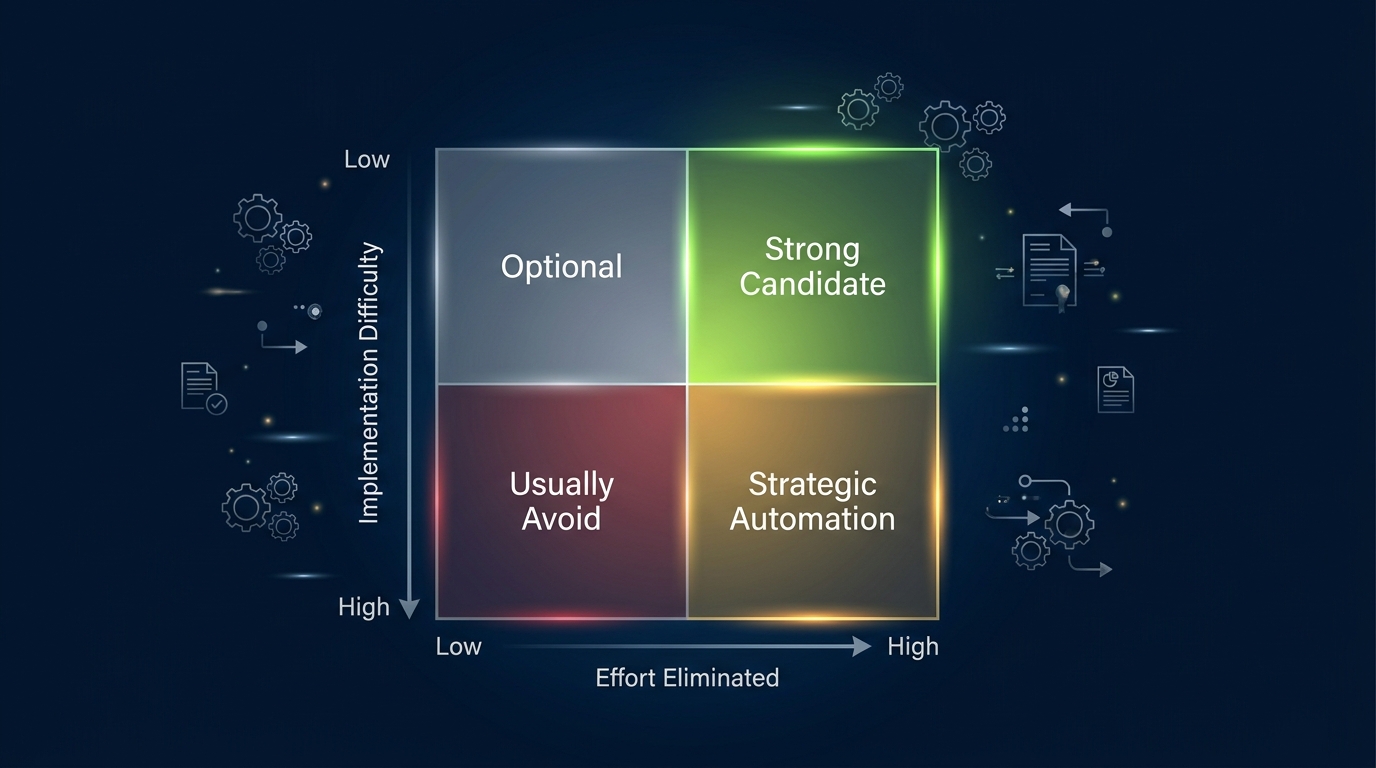
- Strong Candidate (high effort eliminated, low difficulty) - high ROI, fast to implement
- Strategic Automation (high effort eliminated, high difficulty) - significant value, requires investment and ownership
- Optional (low effort eliminated, low difficulty) - works fine manually
- Usually Avoid (low effort eliminated, high difficulty) - high cost, low return
This is not a new idea. What makes the matrix useful is not the grid itself - it is how you score opportunities against it, how AI is changing which quadrant processes fall into, and what the real deciding factor is once you have identified a candidate.
Scoring Opportunities
For teams who want to apply the matrix rigorously, each automation opportunity can be scored across six dimensions on a simple 1–5 scale:
- Volume - from runs rarely (1) to runs thousands of times (5)
- Time per occurrence - from seconds per transaction (1) to minutes or hours per transaction (5)
- Process stability - from rules change frequently (1) to stable, well-documented rules (5)
- Environmental control - from depends on external systems you don't control (1) to runs entirely within your own systems (5)
- Data predictability - from highly variable, unstructured inputs (1) to clean, consistent, structured inputs (5)
- Error cost - from low consequence if done wrong (1) to high consequence - compliance, safety, financial (5)
High scores on volume and time per occurrence indicate a strong value case. High scores on stability, control, and data predictability indicate easier implementation. Error cost acts as a multiplier - even low-volume processes with catastrophic error costs can justify automation for auditability alone.
This scoring model does not need to be complex. A team can score each dimension on a simple 1–5 scale in a single meeting and immediately see which opportunities cluster in which quadrant.
Try It: Score Your Own Processes
Use the interactive matrix below to score your own automation opportunities. Add your processes, adjust the sliders, and see where they land on the grid.
Want the full-page version? Open the Automation Opportunity Matrix tool.
The Quadrants
High Effort Eliminated, Low Difficulty - Strong Candidates
This is where most organisations should start.
These are repetitive, predictable, high-frequency tasks running within systems you control. The business rules are stable. The inputs are well understood.
Examples include file exports, metadata updates, notification workflows, data synchronisation between controlled systems, and scheduled report generation.
These processes often map directly to autonomous or managed automation on the automation spectrum. They build organisational confidence, demonstrate measurable ROI, and create momentum for more ambitious projects.
Start here. Prove the value. Then move to harder problems.
High Effort Eliminated, High Difficulty - Strategic Automation
This is where the most significant value lives - but it requires careful design, realistic expectations, and clear ownership.
These are high-volume processes with variable inputs, multiple system dependencies, or evolving business rules. Document processing with inconsistent formats. Multi-system workflows spanning internal and external platforms. Compliance-driven processes where the rules shift. Classification tasks where the data is unstructured.
These opportunities likely require managed or human-gated automation, often with AI preprocessing steps to handle the messy front end.
The critical insight is that even partial automation at this scale is transformative. If a process runs 100,000 times a year and you automate 80% of it, you have eliminated 80,000 manual transactions. The remaining 20,000 still require human involvement - but that is a fundamentally different problem from 100,000. The goal is not perfection. The goal is to eliminate as much repetitive work as possible and handle exceptions efficiently.
These opportunities are worth the investment. But they need realistic expectations, robust exception handling, and - above all - clear ownership.
Low Effort Eliminated, Low Difficulty - Optional
These processes work fine manually. Automation is technically possible, and it may be straightforward to implement, but the return may not justify even a modest investment.
That said, watch for processes that are low effort now but growing. A task that takes five minutes once a week today may take five minutes fifty times a week next year. The matrix is a snapshot - revisit it periodically.
Low Effort Eliminated, High Difficulty - Usually Avoid
High effort to build. Low frequency of use. The automation may cost more than the manual process it replaces.
There are exceptions. Regulatory or compliance requirements sometimes mandate automation for auditability, regardless of volume. Processes where error cost is extremely high - where a single mistake has serious financial, legal, or safety consequences - can justify automation even at low volume. But these are the exceptions, not the rule.
For most organisations, this quadrant is where automation budgets go to die. Be honest about whether an opportunity truly belongs here, and be willing to leave it manual.
How to Use the Matrix
If you want to apply this framework, the process is straightforward:
-
Map your current manual processes onto the grid. Score them against the six dimensions. This can be done in a single workshop.
-
Start top-right. High effort eliminated, low difficulty. Build confidence. Demonstrate ROI. Let the organisation see what automation looks like when it works well.
-
Move to bottom-right once maturity exists. High effort eliminated, high difficulty. These opportunities require investment, realistic expectations, and operational ownership. Attempt them only when the organisation has the support model to sustain them.
-
Reassess periodically. The matrix is a snapshot, not a permanent classification. What was impractical last year may be straightforward today. Review it at least annually.
-
For every opportunity, answer the ownership question. Who will own this after go-live? If you cannot answer that, the opportunity is not ready - regardless of where it sits on the grid.
The Takeaway
Not every process is worth automating. The organisations that get the best return from automation are not the ones that automate the most - they are the ones that automate the right things.
The matrix gives you a framework for deciding what to automate. But the quadrants are not static - AI is shifting the boundary of what can be automated, moving processes that were once impractical into reach. And the real gate - the one that determines whether an automation delivers lasting value or quietly degrades - is not technology. It is ownership.
Start with the matrix. But finish with the question: who owns this?